Choosing the right format matters more than choosing the right hour
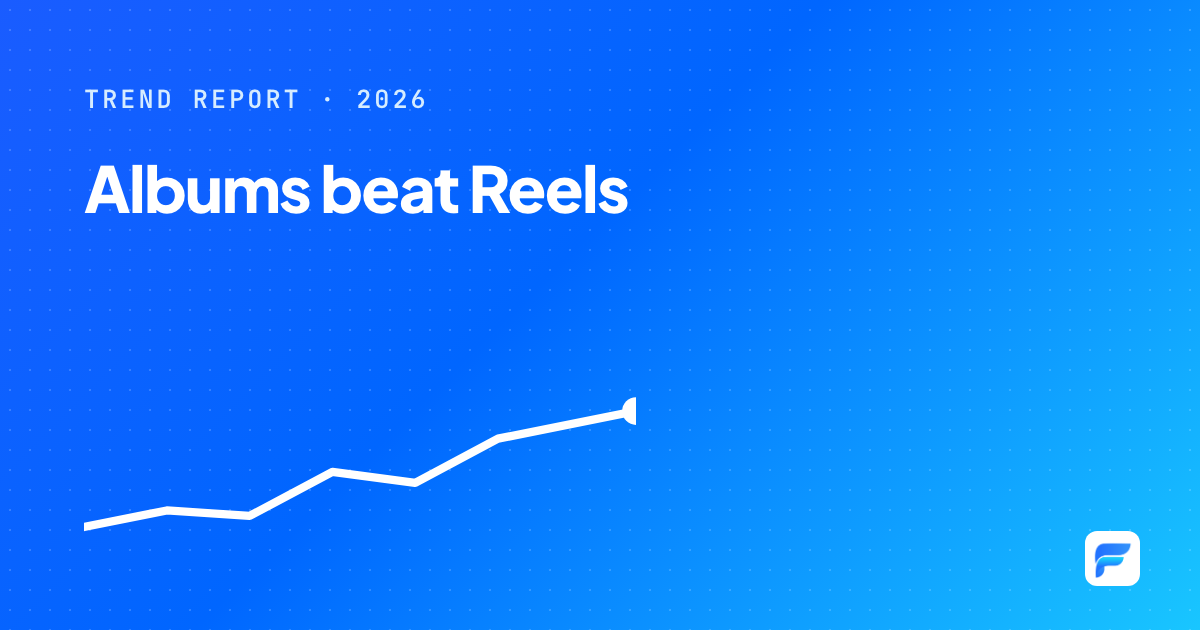
- Multi-photo albums beat single photos on 74% of Pages (1.44x); Reels lose to albums on 66% of Pages.
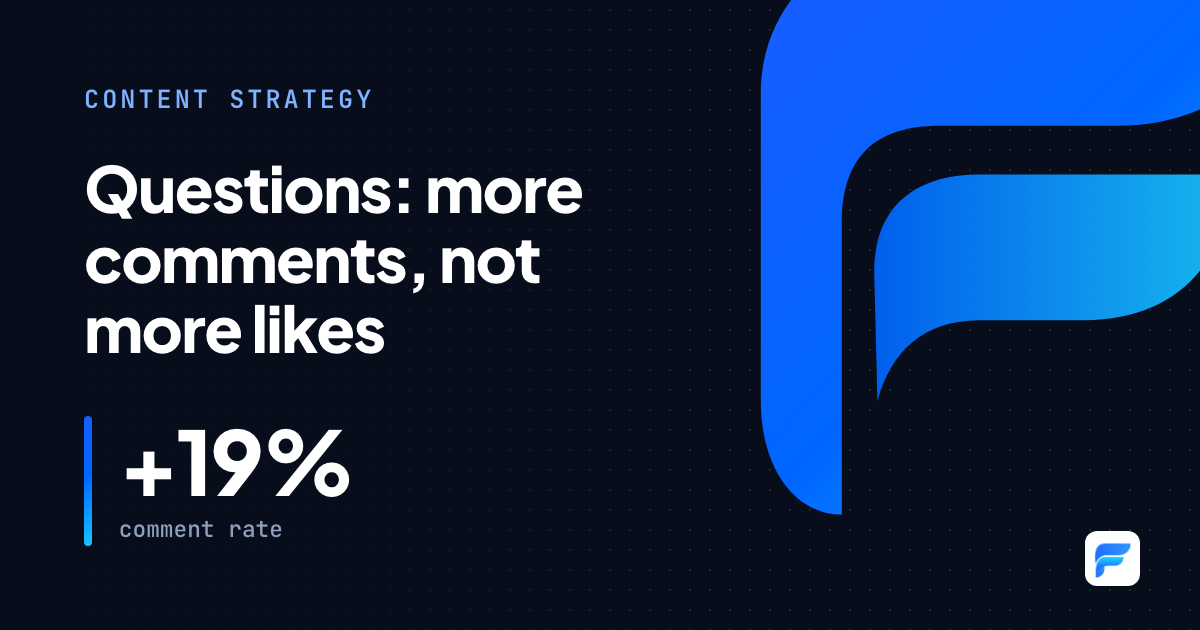
- Questions lift the comment rate on 69% of Pages, but don't raise total engagement.
- Caption-less posts reach just 0.30x of normal; posting day and hour differ by less than 5%.
Are Reels the best format on Facebook Pages? Should captions be long or short? When should you post? Instead of relying on gut feeling or generic advice, we read 8,644 posts from 83 Pages tracked on Fanpage Insight, from news outlets and consumer brands to education and B2B companies.
Some results run against popular belief. The most consistently winning format isn't Reels, and posting time makes almost no difference.
01 · How to read this reportComparing within the same Page
A news Page with millions of followers will always out-engage a small business Page. Pool everything together and the big Pages decide every conclusion. So for each question we compare two groups of posts within the same Page, for example albums versus single photos on that Page, and then aggregate across all Pages.
- Ratio (e.g. 1.44x): group A's median engagement as a multiple of group B's, taking the median across Pages.
- Share of Pages (e.g. 74%): the percentage of Pages where group A beats group B. It tells you how consistent the result is.
- Only Pages with at least 5 posts in each group are counted.
02 · Finding 1Multi-photo albums are the most consistent winner
Single photos still make up 41% of posts, but when a Page publishes a multi-photo album, it out-engages that Page's single photos on 74% of Pages, with a ratio of 1.44x.
Engagement versus single photos on the same Page
Median across Pages · dashed line is parity with single photos (1x)
Source: Fanpage Insight · 8,644 posts, 83 Pages · text-only and link posts have few qualifying Pages; read with caution.
Albums tell several moments in one post
Multi-photo albums beat single photos on 74% of 62 qualifying Pages. Video beats single photos on 63% of Pages.
If you mostly post single photos, shifting some of them to albums is the cheapest change likely to lift engagement.
03 · Finding 2Reels aren't a universal answer
Reels only match single photos (1.07x, ahead on 52% of Pages). Put next to albums on the same Page, Reels lose on 66% of Pages, with a ratio of 0.77x.
Reels lose to albums on most Pages
Across 53 Pages that publish both, Reels reach 0.77x the median engagement of albums and beat them on only 34% of Pages.
Don't move everything to Reels because of a trend. Reels cost more to produce; test them alongside albums and keep whichever wins on your own Page.
04 · Finding 3Questions bring comments, not likes
24% of posts include at least one question. On Pages that use questions regularly, question posts get a 19% higher comment rate on 69% of Pages. But total engagement doesn't rise: the ratio is 0.94x, higher on only 39% of Pages.
Questions trade likes for comments
Questions without a prize lift the comment rate by 1.19x (42 Pages). Giveaways nearly double it (1.95x, 15 Pages) while total engagement sits at 0.88x.
Use questions when the goal is conversation and audience understanding, not total engagement. More in Questions in captions.
05 · Findings 4 & 5Captions: the must-have, and what matters less than you think
Effect of caption features
Versus posts without that feature on the same Page
No-caption posts are mostly events and single photos; only 16 Pages qualify.
Posts without a caption are all but ignored
On the 16 Pages with caption-less posts, those posts reach just 0.30x the engagement of captioned posts, and on no Page do they come out ahead.
Always include at least one line telling viewers why they should stop.
Other features matter far less. Posts with a link in the caption trail on 65% of Pages (0.87x). Posts with four or more emoji trail emoji-free posts on 62% of Pages. Hashtags give mixed results. For caption length, each length band sits within 7% of the Page's normal level.
06 · Finding 6What you post matters more than when
Compared within the same Page, engagement by weekday and by time slot only ranges from 0.97x to 1.05x of normal. Weekends are slightly ahead (1.05x on Saturday), but not enough to rebuild your calendar around.
Posting day and hour vary by less than 5%
Weekday ratios range 0.99x – 1.05x; time-slot ratios (Vietnam time) range 0.97x – 1.03x.
Time spent hunting for a "golden hour" is better spent choosing formats and topics, where the differences are much larger.
07 · What to doFive changes for next month's content calendar
Move some single photos to albums
Albums beat single photos on 74% of Pages. Start with topics that naturally have several moments: events, multi-angle products, behind the scenes.
Test Reels alongside, don't replace
Publish the same story as a Reel and an album over two weeks and keep whichever wins on your Page.
Never leave the caption empty
One line of context is enough.
Ask when you want to listen, not when you want likes
Set a separate comment goal for question posts.
Stop chasing the golden hour
Pick a consistent slot and invest the effort in content.
Everything is gathered into a checklist in Playbook: 7 rules for writing Page posts.
08 · LimitationsHow to read this report correctly
Data limitations
- 81% of posts are from Sep–Oct 2026 because of collection timing, so seasonal trends aren't covered.
- The 83 Pages span many industries plus global Pages, not enough to split results by industry.
- Public metrics only: no reach, video views or ad data.
Correlation, not causation
- The numbers show which groups of posts tend to perform better; they don't prove the format is the cause.
- Use them to choose what to test, then verify with an A/B test on your own Page.
Methodology & data sources
This report uses every public post from Jan 1 to Oct 20, 2026 on Pages with at least 20 posts in the period, recorded on Oct 27, 2026. Full captions were read for 8,644 posts. Every comparison is made within a Page, then aggregated by median.
- Sample
- 8,644 posts, 83 Pages
- Engagement
- Reactions + comments + shares
- Comparison
- Within each Page, at least 5 posts per group
- Posting time
- Vietnam time (UTC+7)
- Giveaway
- Captions with a question and keywords such as minigame, giveaway, prize
Analyze your own Page in minutes
The same technology behind every piece on this Blog. No admin access needed.
Start for free